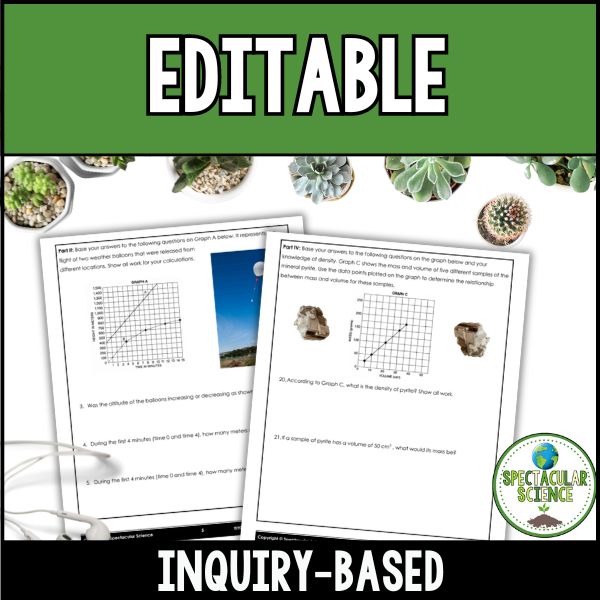
Engage your students in hands-on scientific exploration with this no-prep Graph Analysis Lab! In this activity, students work with multiple real-world data sets to construct graphs (line and bar), calculate rate of change, and interpret relationships between variables. They analyze trends such as temperature change over time, categorical data comparisons, motion of weather balloons, cooling water, and density relationships to determine direct relationships, indirect relationships, and dynamic equilibrium.
This lab is designed to move students beyond simply making graphs and into using graphs as scientific evidence to explain what is happening in a system.
Why Teachers Love This Lab:
- Hands-On Learning – Students actively construct and interpret graphs using real scientific data instead of just reading about them.
- Builds Critical Thinking – Students analyze patterns, slopes, and relationships to make evidence-based conclusions.
- Strengthens Graphing Skills – Reinforces essential skills including axis setup, scaling, graph selection, and rate of change.
- Easy to Implement – Fully structured, student-friendly, and ready to print and use with minimal prep.
What’s Inside?
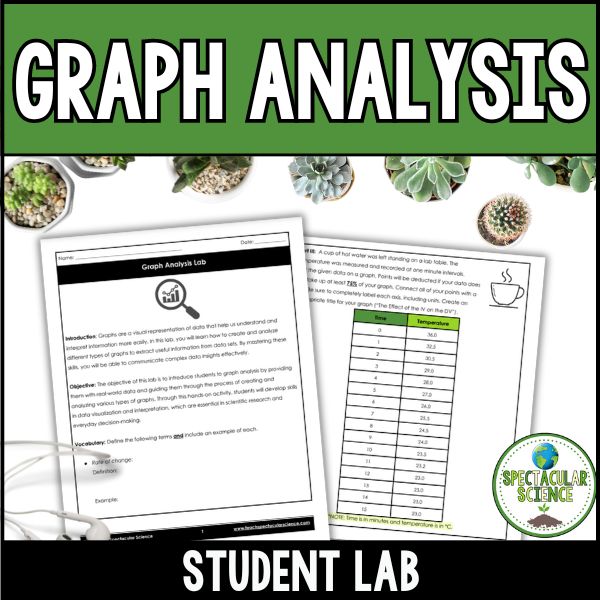
- Student Lab – Step-by-step activities guiding students through graph construction, data analysis, and interpretation across multiple real-world scenarios.
- Instructor Answer Key – Complete solutions and explanations to support grading and classroom discussion.
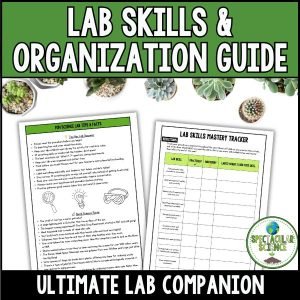
- Teacher Guide – A comprehensive instructional guide with NGSS alignment, teaching notes, common misconceptions, differentiation strategies, and extension ideas to support confident implementation.
Make data analysis meaningful and accessible! This lab helps students visualize scientific relationships, build confidence with graphing, and develop strong foundational skills in data interpretation.