Unlock the power of data visualization with this Communicating Data Through Graphs Presentations and Guided Notes resource. Designed to answer the essential question, “How are graphs used to communicate data?”, this resource offers students a deep dive into the world of data communication through various types of graphs.
Why Teachers Love This Resource:
✅ Clear and Engaging Presentations – Two comprehensive presentations walk students through different types of graphs, their construction, advantages, and real-world applications.
✅ Real-World Relevance – Students will learn the importance of graphs in science, and how to use them to analyze data and make inferences.
✅ Skill Development – Helps students build essential data literacy, including interpreting graphs, distinguishing variables, and understanding concepts like rate of change and percent error.
✅ Efficient & Time-Saving – Each presentation is designed to fit within a 25-minute lesson, making it easy to integrate into your curriculum without adding extra time commitments.
✅ Interactive & Engaging – Guided notes provide structure and encourage active participation as students follow along with the presentations.
What’s Inside?
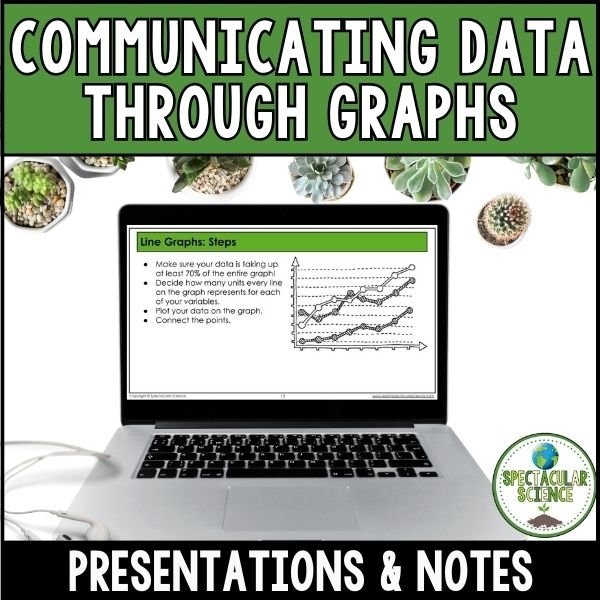
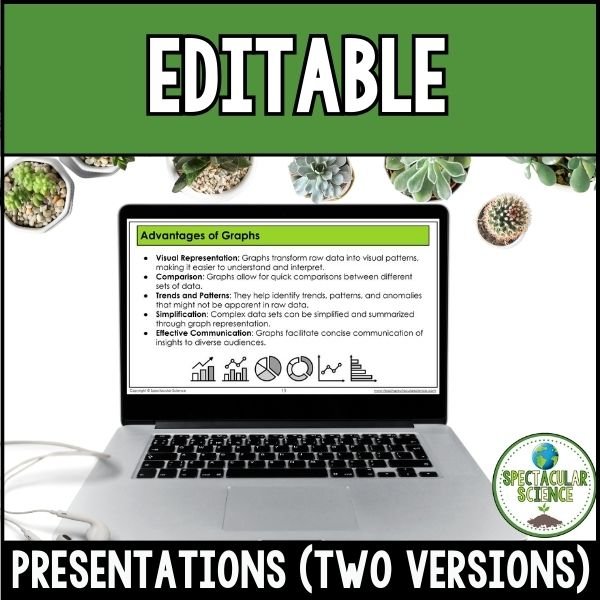
- Presentation #1 – Introduction to the purpose of graphs and how to construct bar, line, and circle graphs. Learn the advantages of using graphs and real-world applications, plus common mistakes to avoid.
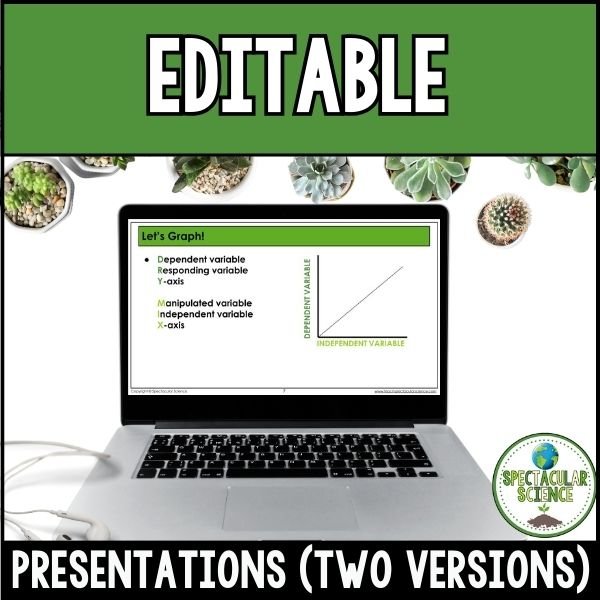
- Presentation #2 – Focuses on graphs in science, introducing key concepts like variables, observations, inferences, rate of change, and percent error.
- 48-Slide Presentations – Two dynamic presentations that are easy to follow and visually engaging.
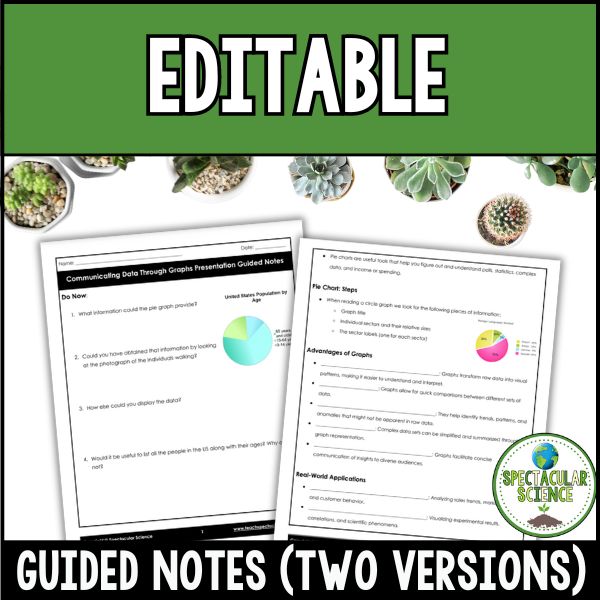
- Guided Notes (13 Pages) – Printable notes that help students organize key information and actively engage with the material.
Elevate your students’ ability to communicate data effectively by integrating this comprehensive, hands-on resource into your curriculum. Empower students with the tools to understand and interpret data through graphs, fostering analytical thinking and scientific inquiry in your classroom!