Science Graphing Unit – Data Representation, Interpretation, Analysis Notes
Dive into the world of data representation with this high-quality Graphing Unit. Throughout this comprehensive unit, students engage with the essential question, “How are graphs used to communicate data?”
$7.00
Description:
Equip your students with essential data literacy skills through this engaging, no-prep Graphing Unit! Designed to help learners explore the power of graphs in communicating complex information, this unit fosters critical thinking, analytical reasoning, and hands-on experience with data representation.
Why Teachers Love This Unit:
✅ Real-World Connections – Students see how graphs are used in everyday life, news, and scientific studies. ✅ Engaging & Interactive – Hands-on labs and activities reinforce key graphing concepts. ✅ Strengthens Critical Thinking – Encourages students to interpret, analyze, and create meaningful graphs. ✅ No-Prep & Easy to Use – A structured unit that integrates seamlessly into your curriculum.
What’s Inside?
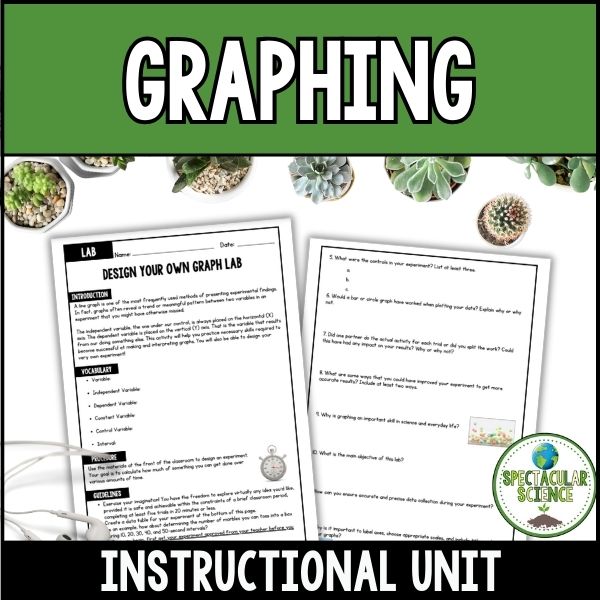
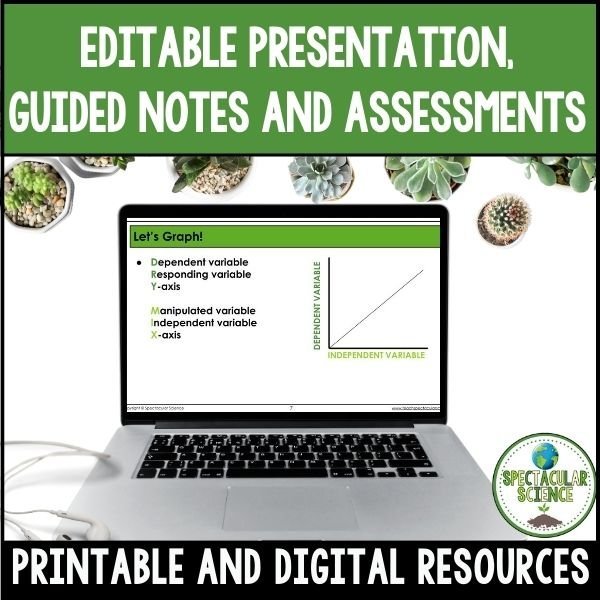
Communicating Data Through Graphs Presentation & Guided Notes – A dynamic, student-friendly introduction to graphing.
Graphing in Your Life Assignment – Helps students recognize graphs in their daily experiences.
Graphing in the News Assignment – Encourages analysis of real-world data in media.
Transform data into meaningful insights! This unit is the perfect way to help students develop strong graphing skills and gain confidence in visualizing and interpreting data effectively.
What busy teachers like you have said:
⭐️⭐️⭐️⭐️⭐️ Amanda B. says, “I used this with my Earth Science class to review different graph types! Total time saver! Thanks!”
⭐️⭐️⭐️⭐️⭐️ Lizzie M. says, “GREAT resource – added it to my SLO unit and it help my kids a lot”
Grade Levels: 6th – 12th
Total Pages: 60+
Teaching Duration: 3 Days
⭐ Looking for quality resources and time-saving tips for your secondary science classroom? ☑ Follow Spectacular Science on TPT ☑ Subscribe to My Newsletter ☑ Check Out My Blog
☑ Follow Me on Instagram
If you have any questions, please do not hesitate to ask.
Thanks for visiting!
Jessica