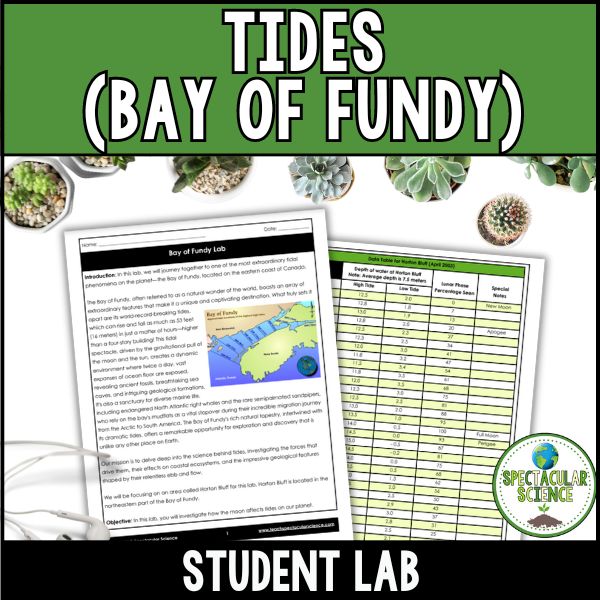
Bring the wonders of oceanography into your classroom with this hands-on, interactive Tides Lab, where students take a virtual journey to the Bay of Fundy—home to some of the most extreme tides on Earth. This engaging activity helps students uncover the science behind tidal forces and explore the unique ecosystem shaped by these powerful natural phenomena.
Why Teachers Love This Lab:
- Real-World Connection – Introduces students to a real location with record-breaking tides, making science feel tangible and relevant
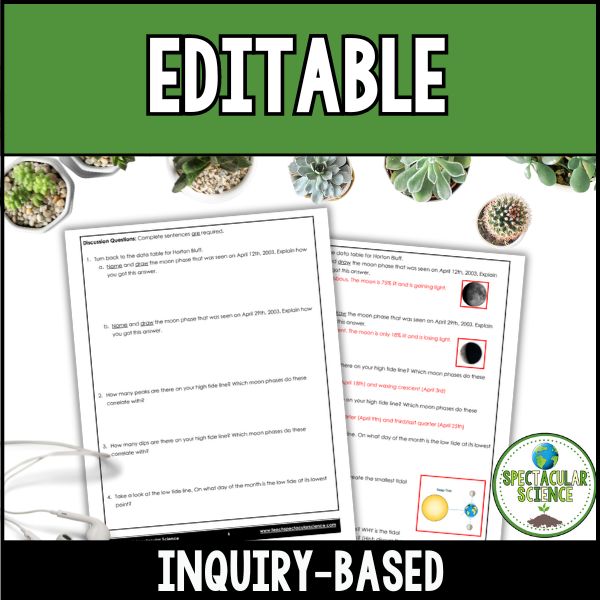
- Promotes Inquiry – Encourages students to think critically about the gravitational forces driving tides and the role of the moon and sun
- Cross-Curricular Learning – Blends Earth science, physics, and environmental science
- Adaptable for Middle and High School – Offers flexibility to suit your students’ needs and curriculum goals
- Interactive and Visual – Helps students visualize tidal cycles and understand their impact on coastal environments
What’s Included?
- Student Lab Worksheet – Guided virtual exploration of the Bay of Fundy with engaging questions and activities
- Instructor Answer Key – Complete answers provided for easy grading and support
Pro Tip: Pair this lab with a short video clip of the Bay of Fundy’s tides in action to grab student attention and provide a striking visual anchor before diving into the science!