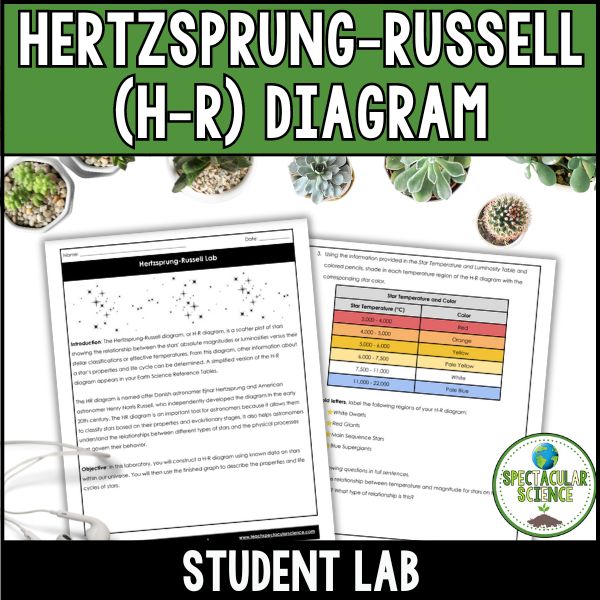
In this Hertzsprung-Russell (H-R) Diagram Lab, students construct a H-R diagram using known data on stars within our universe. They then use the finished graph to describe the properties and life cycles of stars, gaining a hands-on understanding of how stellar characteristics are interconnected.
$3.00
Description:
Bring astronomy to life with this hands-on, interactive H-R Diagram Lab, where students plot real star data to uncover the relationships between a star’s temperature, luminosity, and life cycle. By constructing their own Hertzsprung-Russell Diagram, students gain a deeper understanding of stellar evolution while developing essential data analysis skills.
Why Teachers Love This Lab:
✅ Hands-On Learning – Engages students in active data plotting and analysis. ✅ Enhances Scientific Thinking – Encourages critical thinking about stellar properties and classifications. ✅ Real-World Applications – Uses actual star data to make learning authentic and meaningful. ✅ Visually Engaging – Helps students see the connections between temperature, brightness, and star types. ✅ Perfect for Earth Science & Astronomy Classes – Aligns with curriculum standards and reinforces key concepts.
What’s Included?
? Student Lab Worksheet – Step-by-step instructions for constructing the H-R Diagram. ? Instructor Answer Key – Saves you time with fully completed solutions.
Required Materials:
✏ Pencil – For precise data plotting. ? Colored Pencils – To differentiate star types. ? ESRT (Earth Science Reference Tables) – A crucial tool for accurate star classification.
Make stellar evolution engaging and interactive—grab the H-R Diagram Lab today!
⭐ Looking for quality resources and time-saving tips for your secondary science classroom? ☑ Follow Spectacular Science on TPT ☑ Subscribe to My Newsletter ☑ Check Out My Blog
☑ Follow Me on Instagram
If you have any questions, please do not hesitate to ask.
Thanks for visiting!
Jessica