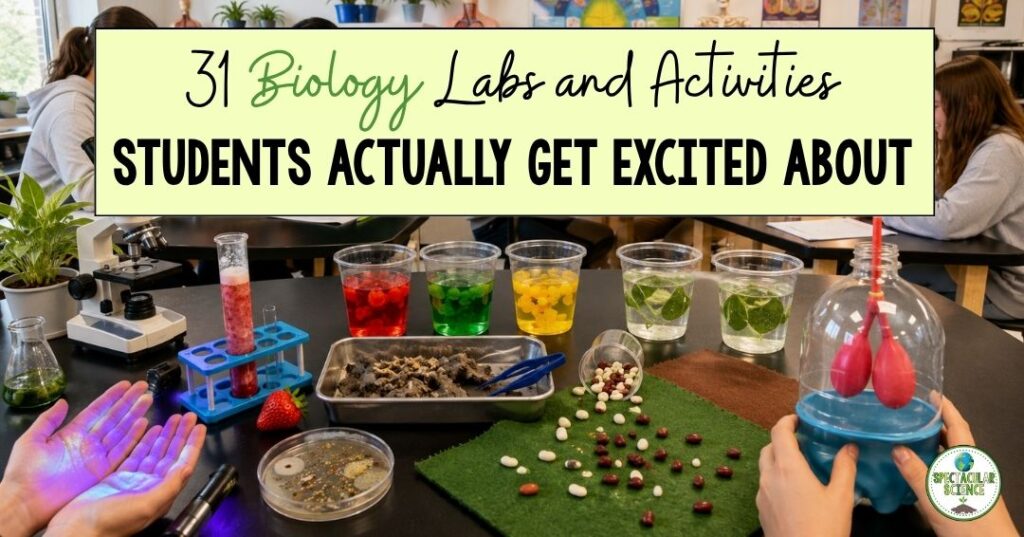
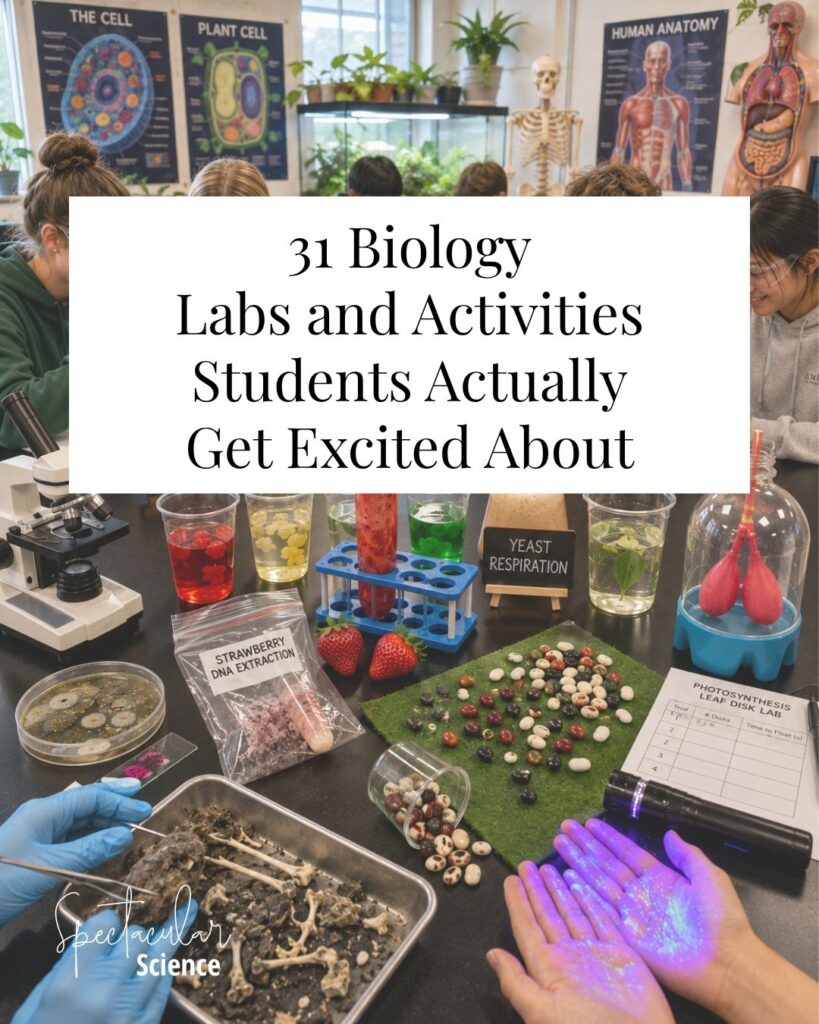
31 Biology Labs and Activities Students Actually Get Excited About
You know that moment when you finish explaining a biology concept, ask whether everyone understands, and the entire class confidently nods?
Then five minutes later, a student asks, “Wait…what does a cell membrane do again?”
Biology includes so many processes students cannot directly see. They cannot watch DNA being copied, follow energy moving through a food chain, or observe water molecules crossing a cell membrane with their own eyes. When those ideas stay trapped in diagrams and vocabulary lists, even attentive students can struggle to make meaningful connections.
That is why hands-on experiences are so valuable.
As a former secondary science teacher, I found that students remembered concepts much longer when they had something concrete to connect them to. A changing egg, rising leaf disks, bubbling yeast, a visible strand of extracted DNA, or an unexpected graph gave us evidence to discuss instead of another definition to memorize.
Of course, not every biology activity needs to be an elaborate, three-day lab. Some of the most effective lessons are quick demonstrations, simple models, or low-prep investigations that help students visualize one difficult idea.
Below, you’ll find 31 biology labs, demonstrations, and activities covering introductory science skills, cells, energy processes, genetics, ecology, human body systems, and evolution. I’ve included approximate timing, preparation levels, grade recommendations, supply ideas, safety notes, and practical teaching tips to help you choose activities that will work in your classroom.
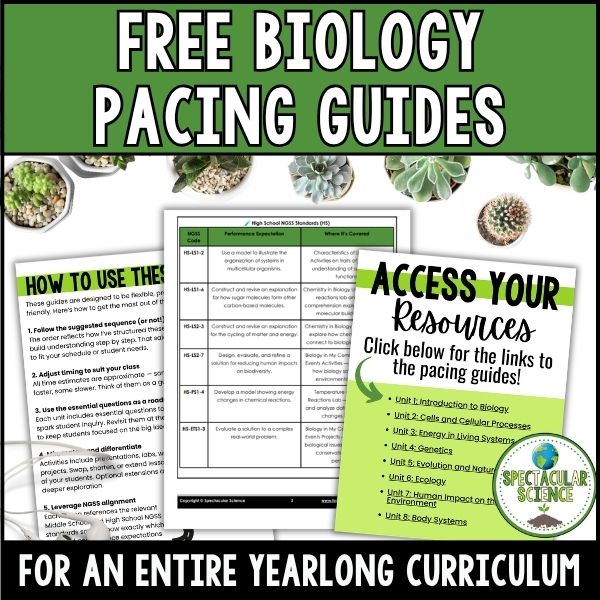
Planning your biology curriculum? Before we dive into these activities, grab my FREE Biology Pacing Guide. It outlines an entire year of biology lessons, labs, projects, and assessments so you can easily map out your course.
The beginning of the year is the perfect time to establish expectations for teamwork, measurement, observation, experimental design, and scientific communication. These activities introduce essential practices without requiring students to already know a large amount of biology content.
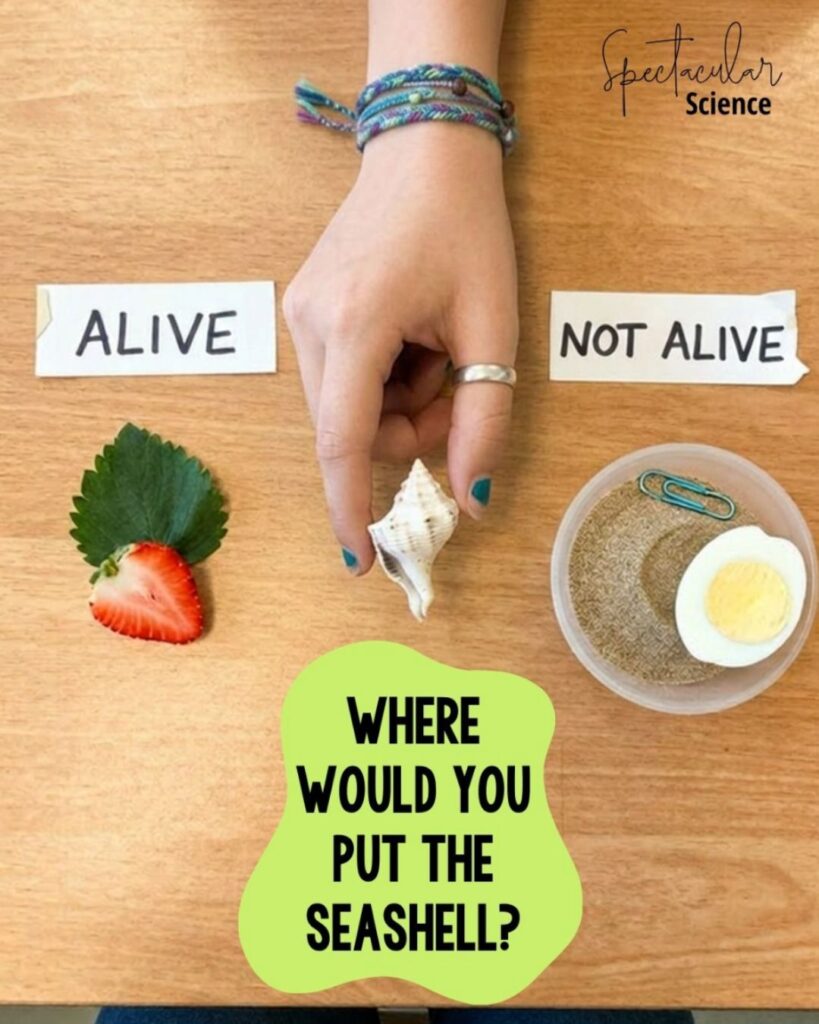
1. Life or Not? Characteristics of Living Things Lab
Instead of beginning your characteristics of life unit with a list of vocabulary terms, give students a collection of mystery samples and ask them to decide which are living, once living, or never living.
Possible samples include leaves, fruit, yeast, yogurt, pond water, feathers, shells, sand, seeds, a boiled egg, and synthetic materials.
Students examine each sample, record observations, and use the characteristics of life to support their classifications. Some examples will be straightforward, while others will generate disagreement—and that is where the best learning happens.
One thing I learned as a science teacher is that students are often much more invested in a concept when they have already argued about it. Once they have debated whether a dormant seed is alive or whether a seashell was ever living, they genuinely want the scientific criteria that will help them resolve the question.
Materials:
Hand lenses
Sample containers
Leaves, seeds, fruit, shells, feathers, or other specimens
Teacher Tip: Do not reveal the classifications too quickly. Ask students which evidence would strengthen their claims and whether one characteristic is enough to classify something as living.
Ready-to-use option: The complete Life or Not? investigation includes student directions, observation tables, analysis questions, teacher notes, and an answer key.
Saving Sam is a beginning-of-year favorite because it feels like a game while quietly revealing a great deal about how students work together.
Students must rescue a gummy worm from a “lake,” place its life preserver around it, and return it safely to its overturned boat. They may use paper clips as tools, but they cannot directly touch Sam, the boat, or the life preserver.
Beyond being entertaining, the challenge introduces:
Perseverance
Problem-solving
Collaboration
Procedural thinking
Communication
Reflection after failure
I especially like activities like this early in the year because I can observe how students approach an unfamiliar problem before grades and content knowledge become factors. You quickly notice who begins experimenting, who organizes the group, who communicates clearly, and who needs encouragement to participate.
Teacher Tip: Resist the urge to rescue groups that become frustrated. Instead, ask questions such as, “What have you already tried?” or “What could you change about your approach?”
Food Allergy Alternative: Replace the candy with pipe cleaners, rubber bands, and small plastic figures.
The scientific method becomes far more meaningful when students use it to answer a question instead of copying its steps from a slide.
Provide each group with a sample of M&Ms and allow students to develop an investigable question. Depending on their experience level, they might examine:
Color distribution
Mass differences
Melting rates
Coating dissolution
Sample-to-sample variation
Students identify variables, develop a procedure, collect data, and determine whether their evidence supports their original prediction.
This investigation also provides an excellent opportunity to discuss sample size. One group may find that blue is the most common color while another finds more orange candies. Instead of treating the discrepancy as a problem, use it to discuss variation, random sampling, and why scientists repeat investigations.
Teacher Tip: Require students to submit their question and variables before distributing materials. It prevents the activity from turning into unstructured candy sorting.
Allergy Note: Students should not consume materials used during the investigation. Colored counters or beads can replace candy.
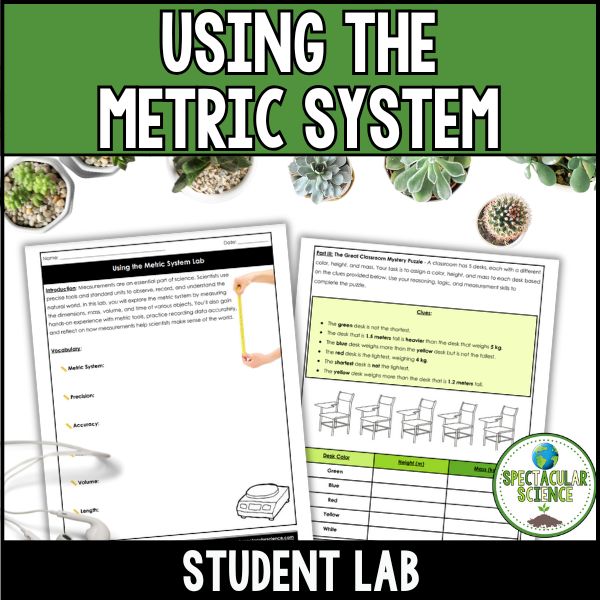
Students need more than a quick reminder that scientists use the metric system. They need repeated opportunities to select the correct tool, read a scale accurately, estimate between markings, and record measurements with appropriate units.
Create stations that ask students to measure:
Length
Mass
Liquid volume
Temperature
Time
Irregular-object volume through displacement
This is one of those activities that may not look flashy, but it prevents countless problems later. A student who learns how to read the bottom of a meniscus now is far less likely to collect unusable data during a more complex lab.
Teacher Tip: Include a few deliberately tricky stations, such as rulers that do not begin at zero or graduated cylinders with different scales. Students need practice interpreting tools rather than relying on memorized routines.
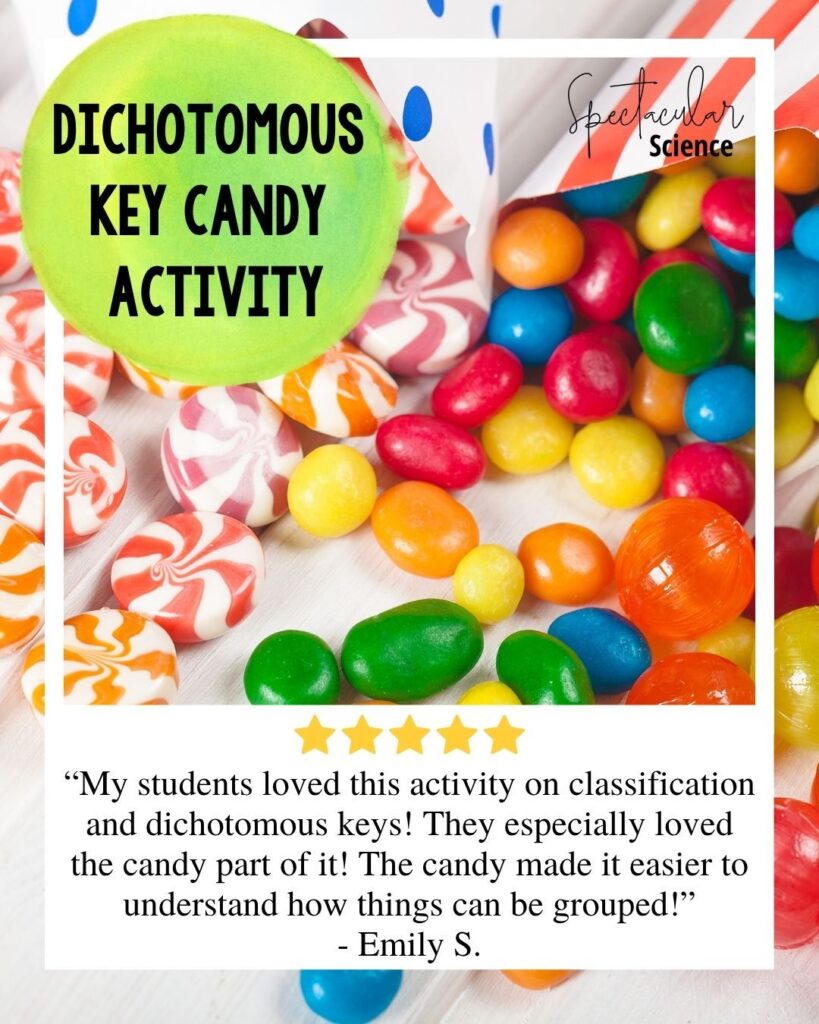
In this activity, students use observable characteristics to create a dichotomous key for a collection of candy or classroom objects.
The challenge is not simply separating one item from another. Students must write paired statements that are clear, mutually exclusive, and based on characteristics another person can reliably observe.
Students quickly discover that vague language such as “large” or “colorful” creates problems. Their first key may not work perfectly, but testing and revising it is an important part of the process.
Materials:
Assorted wrapped candy
Sorting trays
Paper
Pencils
Colored pencils, optional
Non-Food Alternatives: My lab includes printable candy cards – an allergy-friendly option that ensures every student can participate, whether or not real candy is available. You can also use:
Buttons
Plastic animals
Seashells
Leaves
Hardware pieces
Small classroom objects
Laminated organism cards
Teacher Tip: Have groups exchange keys. A classification system that only works for its creator needs revision.
Cells are difficult for students because nearly everything happens at a scale they cannot directly observe. These activities allow them to examine real cells, collect measurable evidence, and evaluate simplified models of cellular processes.
Looking at actual cells under a microscope is often the moment cell structure stops feeling like a collection of labeled cartoons.
Students can observe prepared plant and animal cell slides or create wet mounts using onion epidermis and cheek cells, depending on your school’s policies.
Ask students to compare:
Shape
Arrangement
Cell boundaries
Visible internal structures
Relative size
Differences between prepared and student-created slides
Microscope labs can become frustrating when students spend the entire period searching for a specimen. I recommend demonstrating how to begin on the lowest magnification and focus before moving to a higher power. It is also worth preparing one clear demonstration slide so students know what a successful field of view should look like.
Onion tissue or teacher-approved cheek-cell materials, optional
Teacher Tip: Require students to draw only what they can actually see. Otherwise, many will reproduce a textbook cell diagram rather than record an observation.
Time: 45–60 minutes Prep Level: Moderate Best For: Grades 8–10 Format: Microscopy and Evidence Lab
Students often memorize that prokaryotic cells lack a nucleus while eukaryotic cells contain one. This lab asks them to compare evidence from actual specimens.
Students observe prepared bacterial, plant, and animal cell slides. They record visible structures and compare size, complexity, organization, and cell boundaries.
The investigation also creates an opportunity to discuss limitations. Students may not be able to see every structure listed in their textbook. That is not a failure—it is an authentic reminder that scientists select different tools depending on what they need to observe.
Time: Two class periods or one setup period plus observations Prep Level: Low Best For: Grades 7–10 Format: Quantitative Model Lab
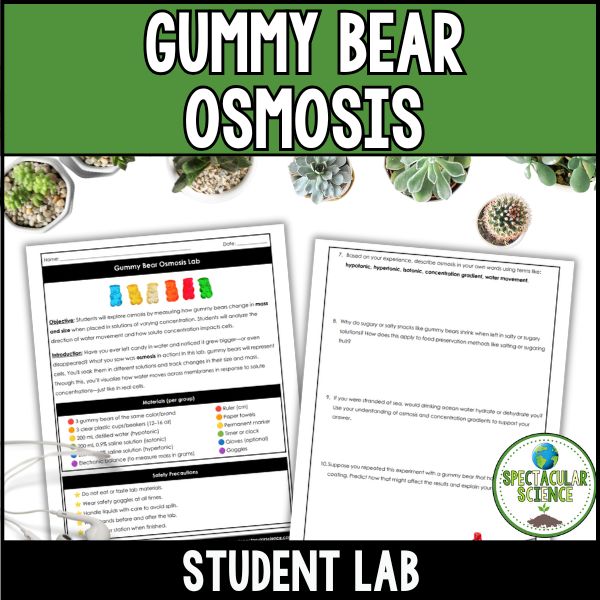
Gummy bears placed in different solutions produce dramatic, measurable changes that make them useful for introducing osmosis.
Students measure the initial mass, length, width, or volume of each gummy bear. They place the bears into solutions such as distilled water, saltwater, or concentrated sugar water and measure them again after soaking.
The gummy bear is not a cell and does not possess a true selectively permeable membrane. It is a gelatin-based model that allows students to investigate how surrounding solution conditions influence water movement.
That distinction matters. I like asking students to evaluate the model rather than presenting it as a perfect representation. It encourages more accurate scientific thinking and prevents misconceptions.
Time: Two to three class periods Prep Level: High Best For: Grades 8–11 Format: Cell Transport Lab
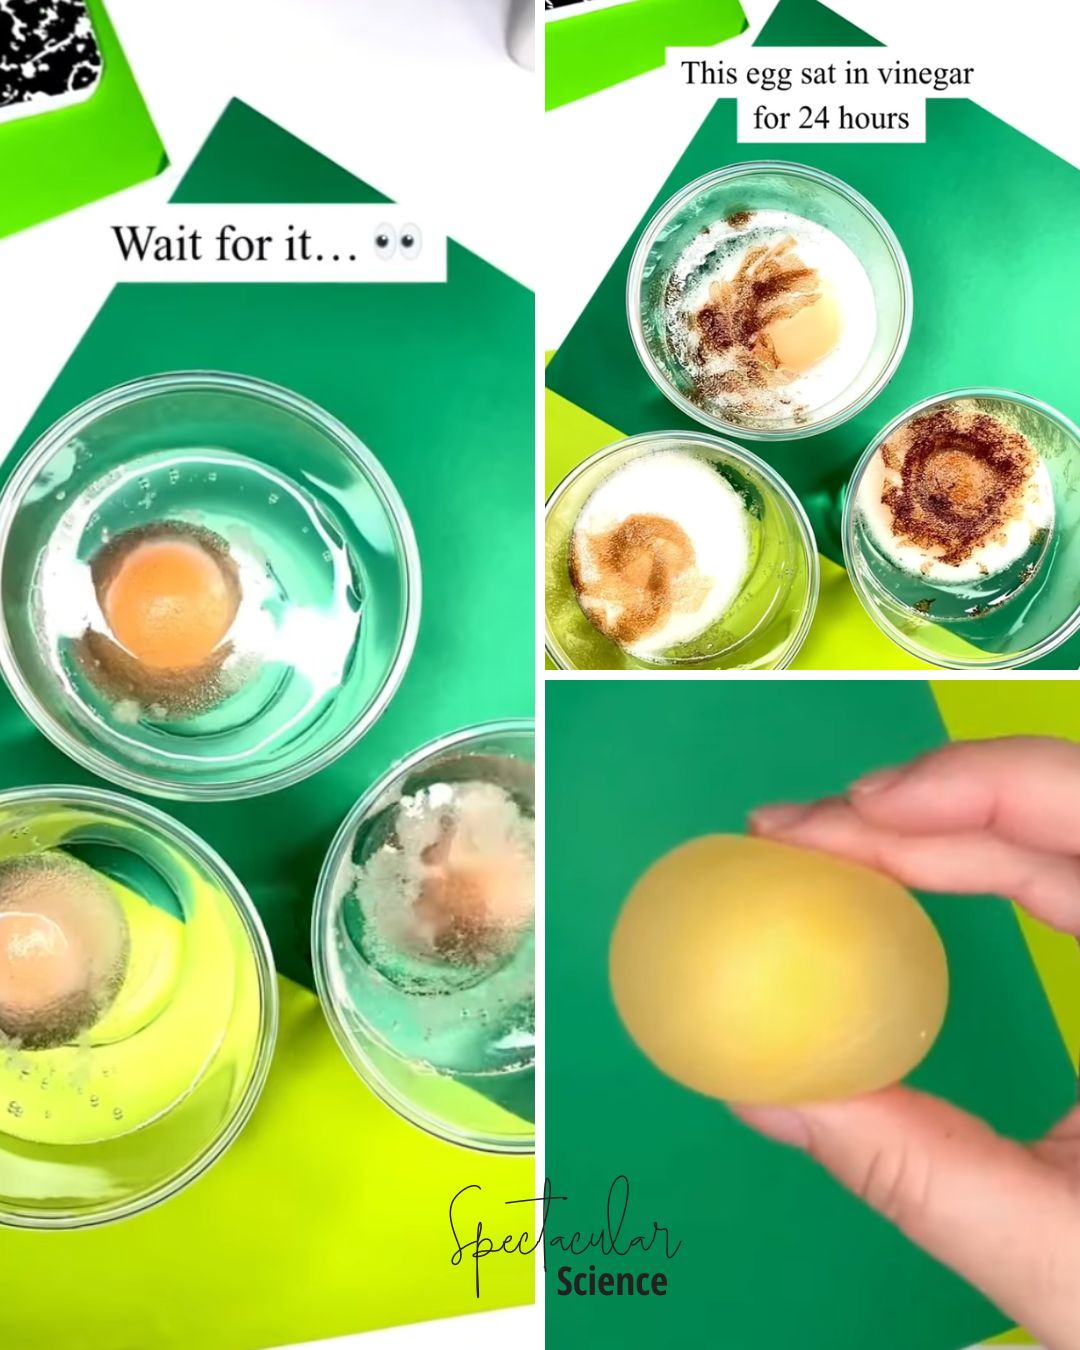
A shell-less egg provides a larger and more biologically relevant model for examining water movement.
Students first soak raw eggs in vinegar. The acetic acid reacts with the calcium carbonate shell, leaving the membrane surrounding the egg intact. Students then place the prepared eggs in different solutions and measure changes in mass or circumference.
The visible changes are memorable, but the egg should still be described as a model rather than a single cell. It contains many cells and biological structures that are not represented in a basic osmosis diagram.
Materials:
Raw eggs
Vinegar
Clear cups
Distilled water
Corn syrup, saline, or sugar solutions
Digital balances
Flexible measuring tapes or string
Gloves
Disinfectant
Teacher Tip: Prepare at least one extra egg per class. Even with careful handling, one usually breaks.
Safety Note: Treat raw eggs as potentially contaminated. Students should wear goggles, wash their hands thoroughly, disinfect work surfaces, and follow school procedures for disposal.
One of the most effective ways to introduce selective permeability is with dialysis tubing.
Fill dialysis tubing with a starch solution and place it in a beaker containing iodine. Over time, students observe the tubing turn dark blue-black as iodine diffuses through the membrane and reacts with the starch inside.
The demonstration naturally leads to discussions about:
Selective permeability
Diffusion
Concentration gradients
Molecule size
Why some substances cross membranes while others do not
I like doing this demonstration before students begin an osmosis lab because it gives them a visual model of molecular movement that makes later discussions much easier.
Teacher Tip: Before revealing the color change, ask students to predict which molecules can move through the membrane and justify their reasoning.
Photosynthesis, Cellular Respiration, and Enzyme Labs
Students cannot directly watch glucose being created or ATP transferring energy. These investigations give them observable indicators—floating leaves, gas production, color changes, or bubbling reactions—that can be connected to otherwise invisible processes.
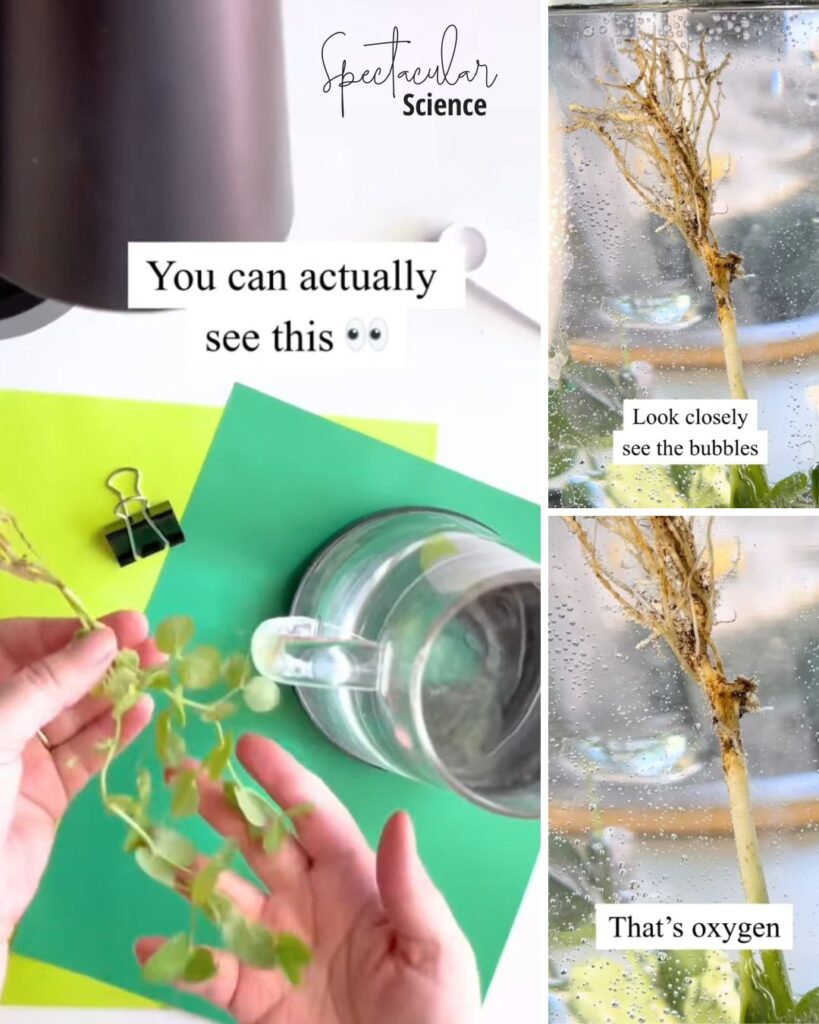
Students place Elodea or another aquatic plant beneath a light source and investigate how a variable affects photosynthetic activity.
Possible variables include:
Distance from the light
Light intensity
Light color
Water temperature
Availability of dissolved carbon dioxide
Students count bubbles or collect gas over a set period.
Bubble production is an indirect estimate of oxygen release, not a perfect measurement of photosynthetic rate. Bubble size varies, and some oxygen remains dissolved in the water. Those limitations make this a useful activity for discussing experimental error.
Teacher Tip: Keep every variable except the one being tested as consistent as possible. Light investigations can become difficult to interpret when groups also change plant size, water volume, and temperature.
Students combine yeast with sugar and warm water, then measure carbon dioxide production using balloons, gas sensors, or water displacement.
Groups can investigate:
Sugar type
Sugar concentration
Temperature
pH
Availability of oxygen
A common classroom setup becomes low in oxygen as the experiment progresses, so much of the observed carbon dioxide may be associated with fermentation. Explain the conditions rather than describing every bubble as evidence of aerobic respiration.
Students use a needleless syringe to infiltrate spinach leaf disks with a dilute baking soda solution. Removing air from the leaf tissue causes the disks to sink.
When placed under a light source, photosynthesis produces oxygen that accumulates inside the leaf tissue. As buoyancy increases, the disks begin to rise.
Students can graph the number of floating disks over time or calculate the time required for half of the disks to float.
Teacher Tip: Demonstrate the syringe technique before groups begin. Most failed trials result from incomplete infiltration rather than a lack of photosynthesis.
Teacher Tip: Ask students how they will measure reaction rate before the lab begins. “More bubbles” is an observation, but foam height, time, or collected gas provides more useful quantitative data.
Safety Note: Students should wear goggles and avoid skin or eye contact with hydrogen peroxide.
Bromothymol blue provides one of the clearest visual demonstrations of the relationship between photosynthesis and cellular respiration.
Students first exhale through a straw into bromothymol blue until the solution changes from blue to yellow, indicating increased carbon dioxide.
Then place aquatic plants into one container under bright light and another in darkness. Over time, students observe how photosynthesis removes carbon dioxide while respiration continues in the dark.
The color changes create an excellent visual for processes students normally cannot observe.
Few biology demonstrations capture students’ attention like Elephant Toothpaste.
Hydrogen peroxide is rapidly broken down by catalase found in yeast, producing oxygen gas that becomes trapped in soap, creating an impressive column of foam.
Although students remember the dramatic reaction, I always remind them that the real focus is enzyme function—not the foam itself.
The demonstration introduces:
Enzymes
Catalysts
Activation energy
Reaction rates
Catalase
Materials
3% or teacher-approved hydrogen peroxide
Active dry yeast
Warm water
Dish soap
Food coloring (optional)
Graduated cylinder
Flask or bottle
Teacher Tip: Ask students what evidence suggests a chemical reaction occurred besides “it made foam.”
Genetics, Heredity, and Biotechnology Labs
Genetics is more engaging when students can examine physical evidence rather than completing an endless sequence of abstract crosses. These labs connect DNA and inheritance to observable traits, molecular patterns, proteins, and mutations.
18. Strawberry DNA Extraction Lab
Time: 45–60 minutes Prep Level: Low Best For: Grades 7–11 Format: DNA Extraction Lab
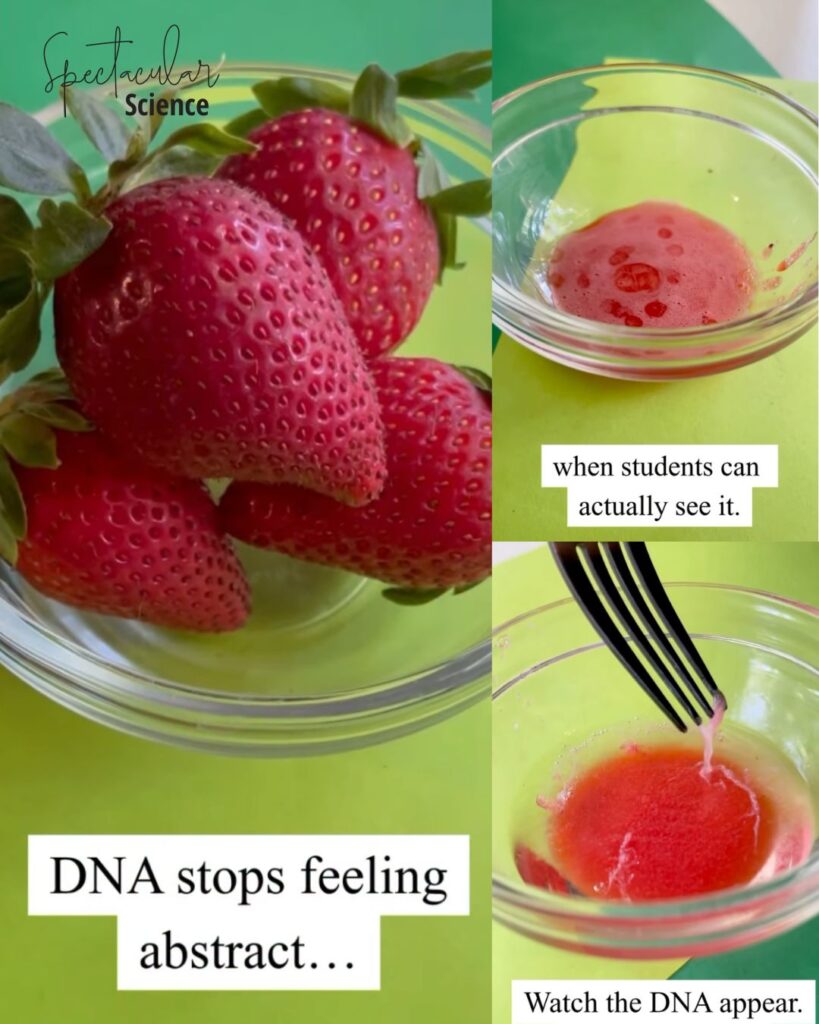
Students mash strawberries, break apart cell and nuclear membranes, filter the mixture, and add chilled alcohol to precipitate DNA.
The cloudy strands students collect contain large quantities of DNA along with possible cellular debris. They are not viewing one isolated chromosome or individual DNA molecule.
This lab works well because each material has a clear purpose:
Teacher Tip: Keep the alcohol very cold. I recommend placing it in a freezer or ice bath before class because warmer alcohol often produces less dramatic results.
Time: 10–15 minutes Prep Level: Low Best For: Grades 7–10 Format: Teacher Demo or Small-Group Model
Students follow written instructions to build a simple structure. Then they repeat the process after a step has been substituted, inserted, or deleted.
Comparing the final structures helps students visualize how changes in instructions may have:
No noticeable effect
A small effect
A major effect
An effect on every step that follows
The model is most effective when you clearly define what each part represents. The written instructions may represent a genetic sequence, while the finished structure represents a protein or phenotype.
Materials:
LEGO bricks or similar building blocks
Original building directions
Altered directions
Document camera, optional
Teacher Tip: Include one altered sequence that produces the same final structure. Students need to see that not every DNA change produces an observable effect.
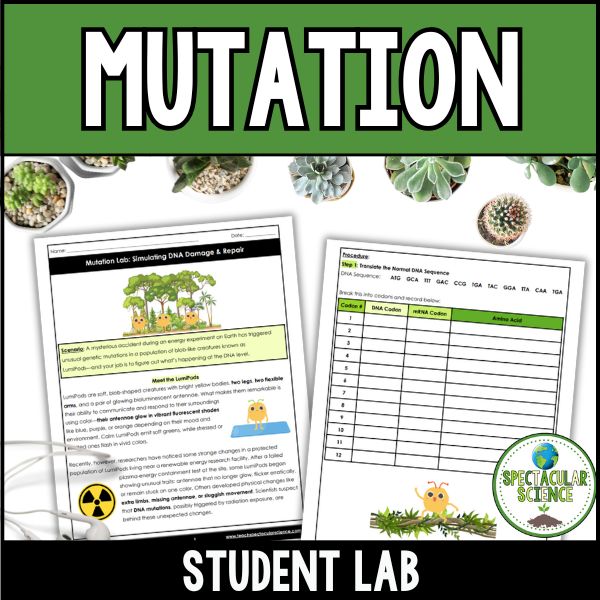
20. LumiPods Mutation Lab
Time: One to two class periods Prep Level: Low Best For: Grades 8–11 Format: DNA and Protein Investigation
In this fictional research investigation, students study LumiPods—organisms whose glowing antennae depend on the proteins they produce.
Students introduce substitutions, insertions, and deletions into DNA sequences. They then:
Transcribe DNA into mRNA
Translate codons into amino acids
Compare original and altered proteins
Determine how the phenotype may change
Support their conclusion with evidence
What makes this activity especially useful is that students follow the complete pathway:
DNA → mRNA → amino-acid sequence → protein → phenotype
It also gives them examples in which mutations have different levels of impact rather than reinforcing the misconception that every mutation is harmful.
Materials:
DNA sequence cards
Codon charts
Colored pencils
Student analysis pages
Calculators, optional
Teacher Tip: Have students highlight the point where the original and mutated sequences first become different. This makes the effects of frameshift mutations much easier to follow.
Ecology gives students opportunities to investigate living systems beyond the microscopic level. These labs examine populations, communities, energy movement, biodiversity, and relationships between organisms and their environments.
Students often struggle to understand why toxins become more concentrated higher in a food chain. This simple demonstration makes the concept easy to visualize.
Use colored beads to represent pollutants moving through an ecosystem. Producers begin with only a few beads, primary consumers collect many producers, secondary consumers collect many primary consumers, and top predators eventually accumulate the greatest number of beads.
By the end of the demonstration, students can clearly see why organisms at higher trophic levels often experience the greatest effects of pollutants such as mercury or DDT.
Teacher Tip: Pause after each trophic level and ask students to predict which organism will contain the greatest concentration before revealing the results.
Owl pellets provide physical evidence of feeding relationships within an ecosystem.
Students carefully dissect sterilized pellets, separate bones and other remains, and use identification charts to determine which prey organisms may have been consumed. They can then reconstruct food chains or food webs involving the owl and its prey.
This is a true ecology lab because students use biological evidence to investigate predator diets and trophic relationships.
Teacher Tip: Give each group a sorting diagram or labeled tray. Without a system, tiny bones quickly become a pile that is difficult to analyze.
Safety Note: Purchase commercially sterilized pellets and follow your school’s procedures for biological materials. Students should wash their hands after the lab and avoid touching their faces.
23. Duckweed Population Growth Lab
Time: Initial setup plus observations over one to two weeks Prep Level: Moderate Best For: Grades 8–12 Format: Population Ecology Lab
Duckweed grows quickly enough for students to observe population change within a manageable classroom time frame.
Groups place an equal number of duckweed fronds into containers and test how an environmental variable affects population growth. Possible variables include:
Light intensity
Nutrient concentration
Temperature
pH
Population density
Pollutant concentration using teacher-approved materials
Students count fronds over time, graph population size, calculate growth rates, and identify patterns.
Unlike a token-based predator-prey simulation, students are collecting data from a living population.
Teacher Tip: Begin with the same number of healthy fronds in every container. Photographing each container from above can make counting easier and provide a permanent record.
Safety Note: Do not release duckweed into local waterways. Dispose of it according to school procedures because it can spread rapidly in aquatic environments.
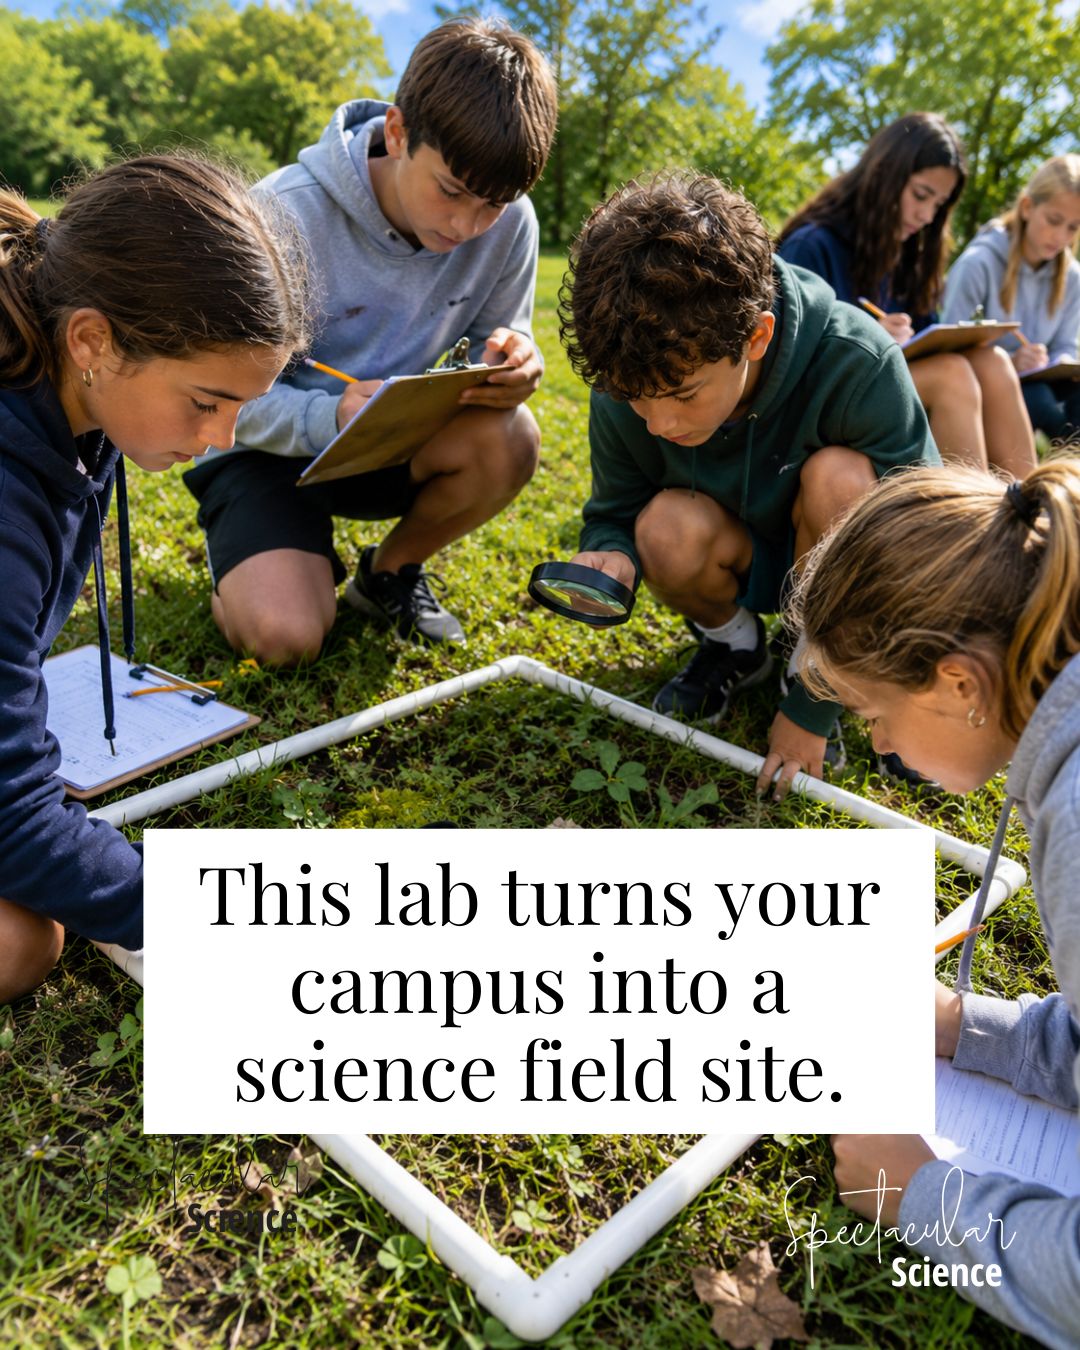
24. Quadrat Biodiversity Field Lab
Time: 45–60 minutes Prep Level: Moderate Best For: Grades 7–12 Format: Outdoor Field Lab
Students use quadrats to sample organisms within several locations around the school campus.
Depending on the season and available habitat, they may record:
Plant species
Ground cover
Insects
Evidence of animal activity
Species richness
Relative abundance
Students then compare sites and consider how sunlight, soil, moisture, mowing, foot traffic, or development may influence biodiversity.
This lab introduces authentic ecological sampling. Scientists often estimate the characteristics of a large area by examining representative samples rather than counting every organism.
Teacher Tip: Test each sampling area before class. A location that looks promising from a distance may provide very little variation once students begin counting.
Indoor Alternative: Create artificial habitats using colored beads, pasta shapes, organism cards, or small classroom objects.
25. Energy Flow in Ecosystems Lab
Time: 45–60 minutes Prep Level: Low Best For: Grades 8–11 Format: Data Analysis Lab
Students analyze how energy moves through trophic levels and why less usable energy remains available at each successive level.
Depending on the investigation, students may:
Construct biomass or energy pyramids
Calculate transfer efficiency
Compare food chains
Analyze organism data
Determine how many producers are required to support higher-level consumers
Examine the energy implications of different food systems
The lab reinforces an important distinction: matter cycles through ecosystems, but energy flows through them and is eventually transferred to the environment as heat.
Materials:
Calculators
Organism and energy data
Colored pencils
Graph paper
Student analysis sheets
Teacher Tip: Avoid teaching the “10% rule” as an exact law. It is a useful generalization, but actual transfer efficiency varies among ecosystems and organisms.
Human biology is naturally relatable, but students can still hold major misconceptions about how systems function. These activities give them observable evidence connected to hygiene, digestion, coordination, and nervous-system responses.
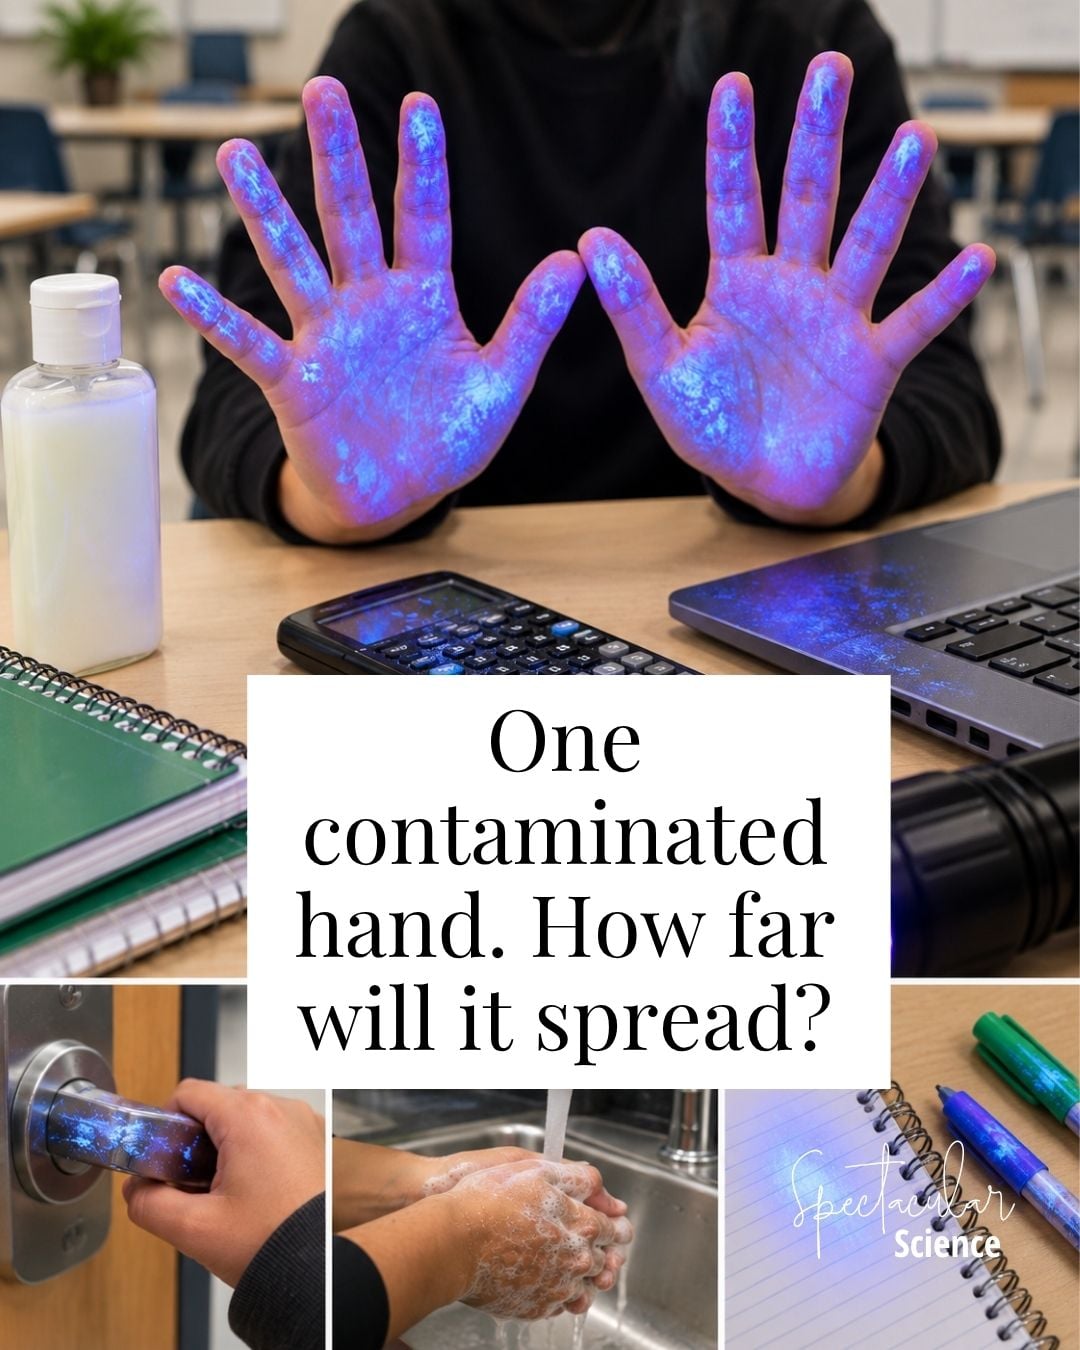
One contaminated hand. One classroom. How far will it spread?
In The Invisible Contamination Challenge, one student secretly begins with Glo Germ simulated contamination. Students follow a chain of everyday classroom interactions, predict where it will travel, and then use a UV light for the big reveal.
But the glow is only the beginning! Students use their evidence to trace the contamination pathway and then get just 9 intervention points to try to break the chain using handwashing, cleaning, or individual materials. They repeat the same interaction chain, compare both rounds, and determine whether their strategy actually worked.
The complete activity is completely guided and includes the student investigation, intervention challenge, data analysis, exit ticket, sample answers, and a comprehensive teacher guide to make the whole thing easy to run.
Common classroom objects (calculators, pencils, etc.)
Teacher Tip: Use only a small amount of Glo Germ and keep the starting student a secret. The mystery of figuring out where it started and how it traveled is half the fun!
Scientific Note: Glo Germ models contamination and removal. It does not contain living pathogens and does not directly measure the number of microorganisms on a student’s hands.
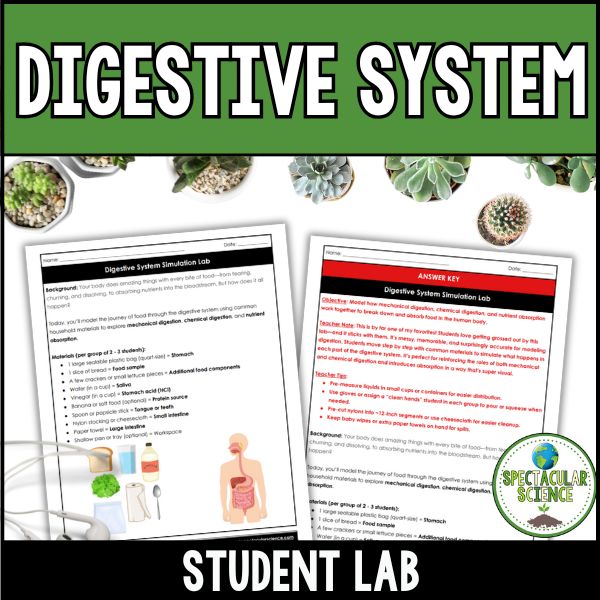
27. Digestive System Simulation Lab
Time: 45–60 minutes Prep Level: Moderate Best For: Grades 7–10 Format: Body Systems Model Lab
Students model the physical and chemical breakdown of food as it moves through the digestive tract.
Common materials can represent:
Teeth and chewing
Saliva and digestive fluids
Stomach mixing
Movement through the intestines
Nutrient and water absorption
Waste elimination
The most important part of the activity is not the mess—it is the model evaluation. Students should explain which biological structures and processes each material represents and where the model becomes inaccurate.
Materials:
Soft food or crackers
Water
Resealable bags
Cups
Funnels
Stockings or mesh material
Trays
Gloves
Paper towels
Teacher Tip: Place every group’s materials on a tray before class. This contains spills and makes cleanup much faster.
Food Safety Note: Students should not consume any materials used during the lab. Review allergies and school food policies before choosing ingredients.
Time: 45–65 minutes Prep Level: Low Best For: Grades 7–11 Format: Human Biology Data Lab
A ruler-drop investigation allows students to collect real data about nervous-system responses.
One student holds a ruler vertically while another positions their fingers near the bottom without touching it. The first student releases the ruler without warning, and the second catches it as quickly as possible.
Students can compare:
Dominant and nondominant hands
Early and later trials
Visual and auditory cues
Individual and class averages
Response consistency
Use the results to discuss sensory receptors, neurons, processing, motor responses, and variation among individuals.
Materials:
Metric rulers
Calculators
Data tables
Graph paper or digital graphing tools
Teacher Tip: Require several trials. A single ruler drop tells students very little because anticipation and random variation strongly affect the result.
Time: 20–30 minutes Prep Level: Low Best For: Grades 6–9 Format: Demonstration or Individual Investigation
Students take a normal or deep breath and exhale into an individual balloon. They measure the balloon’s circumference and compare results across repeated trials.
This provides an approachable introduction to lung volume, but it should be described as an approximation rather than a precise measurement of vital capacity. Balloon elasticity, effort, sealing technique, and air leakage all influence the result.
Students can also build a bottle-and-balloon lung model to examine how changing pressure causes the balloon “lungs” to inflate and deflate.
Materials:
One new balloon per participating student
String
Metric rulers or measuring tapes
Plastic bottles and additional balloons for the model, optional
Disinfectant
Teacher Tip: Do not have students share balloons. Offer the bottle-lung model, provided data, or another non-breathing option for students who cannot or do not wish to participate.
Evolution and Natural Selection Labs
Evolution activities should emphasize changes in populations across generations—not organisms intentionally changing because they need to survive. These investigations connect natural selection to evidence, inheritance, and real biological patterns.
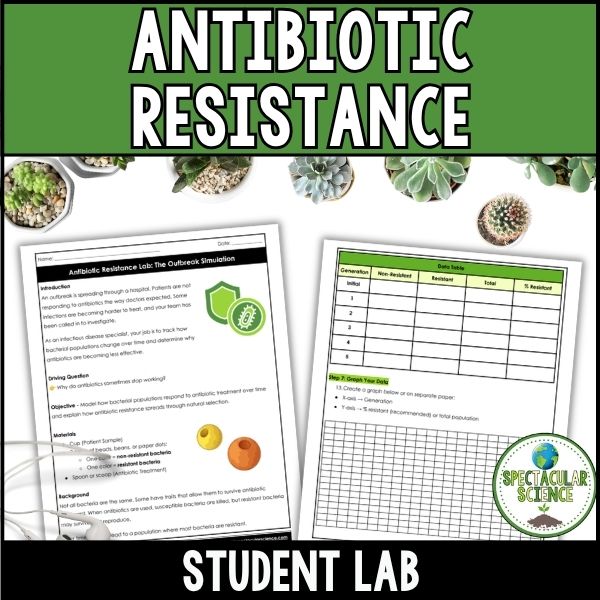
30. Antibiotic Resistance Investigation
Time: 45–60 minutes Prep Level: Low Best For: Grades 9–12
Antibiotic resistance is one of those topics that students hear about in the news but don’t always understand. This hands-on simulation helps make the concept much more concrete.
Students model how bacteria reproduce, mutate, and respond to antibiotics over multiple generations. As they collect and analyze data, they discover why resistant bacteria become more common over time and how natural selection drives this process.
Along the way, students reinforce key concepts including:
Natural selection
Genetic variation
Mutations
Selective pressure
Evolution
Antibiotic resistance
Because students can watch the bacterial population change with each generation, the activity helps connect abstract evolutionary concepts to a real-world issue that affects public health.
Materials You’ll Need
Colored beads or counters
Small cups or containers
Dice or spinners
Student recording sheets
Calculator (optional)
Teacher Tip: Before beginning, ask students whether antibiotics cause bacteria to become resistant. Their answers make for a great discussion after the simulation.
Time: 45–60 minutes Prep Level: Low Best For: Grades 8–12
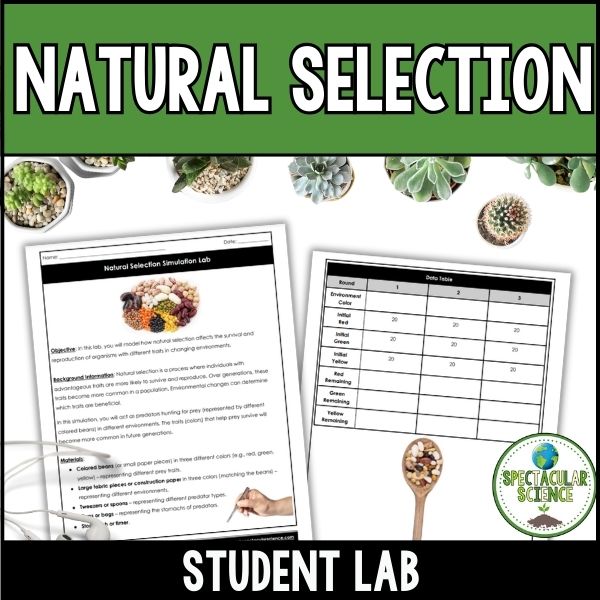
Natural selection becomes much easier to understand when students experience it firsthand.
In this simulation, students become predators hunting different colored “prey” (beans or paper pieces) using tweezers while the environment changes each round. As prey that are better camouflaged survive and reproduce, students watch how advantageous traits become more common over successive generations.
Throughout the lab, students investigate how environmental changes influence survival and reproduction while exploring concepts such as:
Natural selection
Adaptations
Camouflage
Variation
Selective pressure
Fitness
Evolution
By the end of the activity, students use their data to explain why certain traits increase in a population and make connections between their simulation and real-world evolution.
Materials You’ll Need
Colored beans or paper pieces
Colored fabric or construction paper
Tweezers or spoons
Cups or bags
Stopwatch or timer
Teacher Tip: After completing the simulation, challenge students to predict how introducing a new predator or changing the environment again would affect the population. It encourages deeper thinking about selective pressures and helps students connect the activity to evolution in nature.
Making Biology a Subject Students Remember
The best biology lessons aren’t always the ones with the fanciest equipment or the most complicated procedures. They’re the ones that spark curiosity, encourage students to ask questions, and give them the opportunity to investigate the world around them.
Whether students are extracting DNA from strawberries, modeling natural selection with colored beans, measuring reaction times, or watching leaf disks float during photosynthesis, these experiences help transform abstract concepts into something they can see, measure, and explain.
You don’t have to overhaul your entire curriculum overnight. Start with one activity that fits your next unit, your available materials, and the amount of prep time you have. As your collection of labs grows, you’ll build a classroom where students spend less time memorizing biology and more time thinking like scientists.
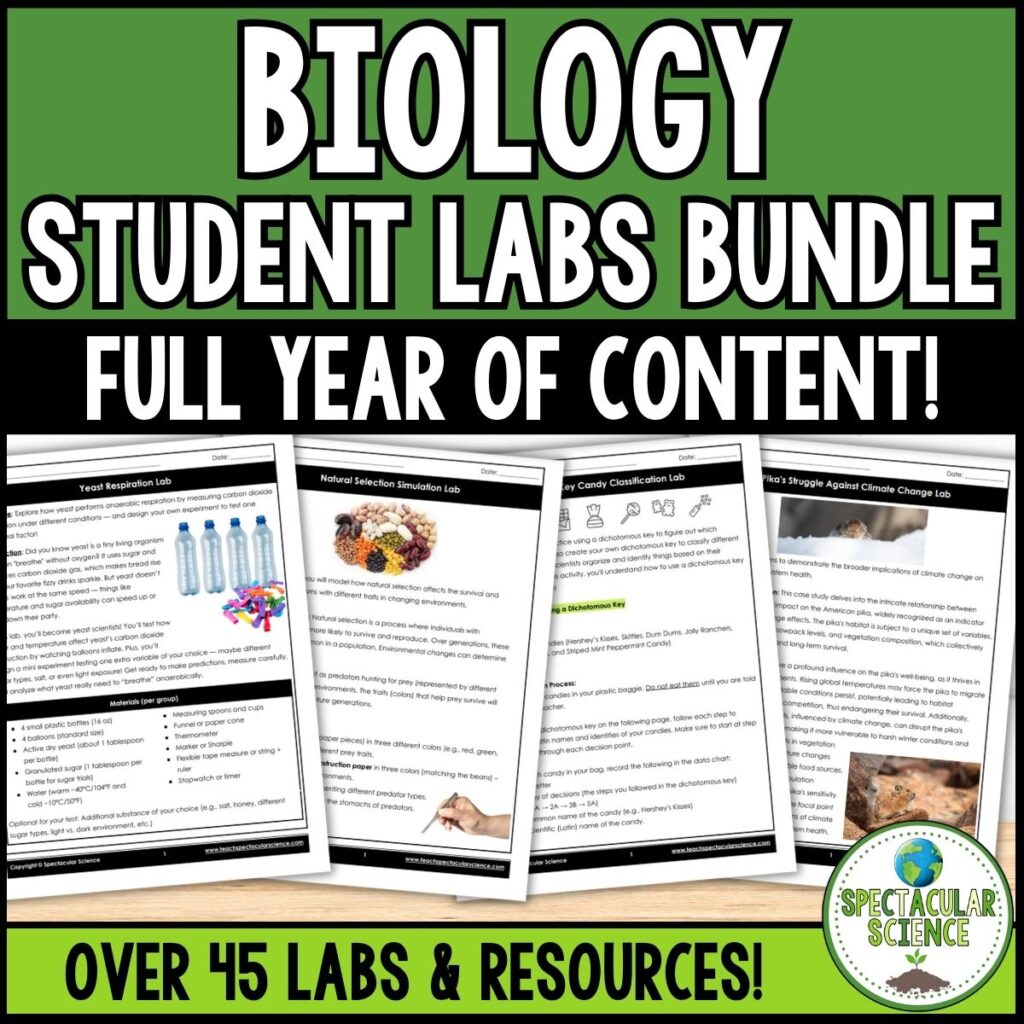
If you’re looking to save planning time while giving your students meaningful, standards-aligned investigations, be sure to check out my Biology Lab Bundle, which includes more than 45 ready-to-use labs, activities, and demonstrations complete with teacher notes, answer keys, and editable student materials.
And if you’re still mapping out your year, don’t forget to grab my FREE Biology Pacing Guide to help you organize lessons, labs, projects, and assessments for an entire year of biology instruction.
Here’s to a school year filled with curious questions, exciting discoveries, and students who can’t wait to find out what they’re investigating next.
Just a heads-up: this post includes Amazon affiliate links. That means if you click through and buy something, I earn a small commission—at no extra cost to you. Thanks for supporting my work!
Hey there! I'm Jessica, author of Spectacular Science. I'm mommy to a sweet little boy, wife to my childhood sweetheart, and lover of Trader Joe's, yoga, and chocolate ice cream. I love teaching science, and look forward to sharing with you.